Azure Stream Analytics is a big data analytics service for the Internet of Things (IoT) that offers real-time data analytics. It helps developers to gain business insights by combining streaming data with historical data. It’s a fully managed service with low latency and scalable architecture for processing large amounts of data.
Microsoft’s Azure Stream Analytics (ASA) solution provides real-time data analytics. Stock trading analysis, fraud detection, embedded sensor analysis, and web clickstream analytics are just a few examples. These chores could be done in batch jobs once a day, but they are far more important if they are done in real-time. For example, if you can detect credit card fraud as soon as it occurs, you’ll be much more likely to prevent the card from being used again. Let’s learn more about it.
Overview
Azure Stream Analytics is a real-time, complicated event-processing engine that can analyse and process large amounts of fast streaming data from various sources at the same time.
Information retrieved from a variety of sources, including devices, sensors, applications, and more, can be analyzed for patterns and relationships. These patterns can be used to start workflows and trigger activities like issuing alarms, feeding data into a reporting platform, or storing altered data for later use. Azure Stream Analytics is accessible on the Azure IoT Edge runtime, allowing IoT devices to process data.
What is the purpose of Azure Stream Analytics?
- Firstly, organizations can utilise Azure Stream Analytics to extract and generate important business intelligence, insights, and information from streaming data.
- For describing transformations, it provides a simple declarative query model.
- Implement temporal operations such as temporal-based joins, windowed aggregates, temporal filters, and other common joins, aggregates, projections, and filters.
- Allows users to go back in time and investigate computations for scenarios such as root-cause and what-if analysis.
- The ability to select and use reference data is provided to users.
Advantages of Learning Azure Stream Analytics
- Firstly, It’s simple to get the start and build an end-to-end pipeline and a fully managed Azure service.
- Secondly, It can run on IoT Edge or Azure Stack for ultra-low latency analytics or in the cloud for large-scale analytics.
- It offers in a variety of locations around the world.
- Next, It’s built to handle mission-critical workloads while meeting reliability, security, and compliance standards.
- Last but not least, It has the ability to handle millions of events per second and deliver results with extremely low latencies.
What to monitor in Azure Stream Analytics?
For monitoring the consumption and performance of Stream Analytics jobs, the following parameters must be monitored:
- SU percent Utilization – An indicator of one or more query stages’ relative event processing capabilities.
- Errors – A Stream Analytics job’s total number of error messages.
- Input events — The total number of events received by the Stream Analytics job.
- In terms of event count, the amount of data transmitted by the Stream Analytics task to the output destination is known as output events.
- Out-of-order events – The number of out-of-order events that were dropped or given an altered timestamp as a result of the out-of-order policy.
How Does Azure Stream Analytics work?
- Firstly, there are three parts to an Azure Stream Analytics job: input, query, and output.
- Secondly, It takes data from Azure Event Hubs, Azure IoT Hub, and Azure Blob Storage and processes it.
- Thirdly, Each job has one or more altered data outputs, and we can be controlled in reaction to the information read. As an example,
- Next, To initiate communications or custom procedures downstream, send data to Azure Functions, Service Bus Topics, or other services.
- Last but not least, To train machine learning models based on historical data or do batch analytics, store data in Azure storage services.
Why is Azure Stream Analytics important for an IoT application?
Azure Stream Analytics is an event-processing engine that lets you look at large amounts of data coming in from devices. Data can come from a variety of sources, including devices, sensors, websites, social media feeds, applications, and more. It also aids in the extraction of data from data streams, as well as the identification of patterns and linkages. These patterns can then be used to trigger various actions downstream, such as warnings, feeding data into a reporting tool, or storing data for later use.
Features of Stream Analytics
Below are the few features of stream analytics
Capacity
- This service can process millions of events every second. Not by the hour or the minute, but by the second. We can, for example, examine a stream generated by Event Hub.
Processing
- Not only does Stream Analytics come with capacity, but it also comes with computing power. It is capable of analyzing stream information, detecting patterns, and initiating various actions.
Resiliency
- This is one of the Azure services that guarantees resiliency.
No data loss
- The service guarantees that no data will be lost once the content reaches the stream. The final destination will receive each bit from the stream.
Scalability
- We can stream numerous streams and processing units at the same time. We can scale up as much as we want this way.
Correlation
- Multiple streams of data can be correlate with ease and assistance. Working with numerous streams of data will not add to the complexity of our system in this way.
SQL Syntax
- Data streams are processed using a language that is remarkably similar to SQL (subset of SQL). We don’t need to learn a new language this way; all we need to know are the functions particular to Stream Analytics.
timestamp of the data
The concept of timestamp and arrival time in a system that analyses data in real-time can alter depending on the ingest source or other rules. As a result, we may define which column should be utilised as the ‘arrival time’ using a command called TIMESTAMP BY.
Data Types
In Stream Analytics, there are four categories of data that can be used:
- Bigint
- Float
- Datetime
- Nvarchar(max)
We can map any sort of data, from integers to strings and dates, using these four primitive types.
- DDL
- The Data Definition Language is a vocabulary for defining Stream Analytics’ data structure. CREATE TABLE, for example, is part of the DDL vocabulary.
- DML
- The language used to retrieve, process, and deal with Stream Analytics is DML Data Manipulation Language. “SELECT”, “WHERE”, “GROUP BY”, “JOIN”, “CASE”, “WITH”, and so on are all part of DML.
- Window
- In-Stream Analytics, a window represents all events inside a given time range. We can collect events, evaluate them, and do a lot more with these time periods. In-Stream Analytics, there are three sorts of time windows, ranging from simple ones that are fix in time to those that start only when a specific event or action occurs in the system:
- Tumbling
- Hoping
- Sliding
- In-Stream Analytics, a window represents all events inside a given time range. We can collect events, evaluate them, and do a lot more with these time periods. In-Stream Analytics, there are three sorts of time windows, ranging from simple ones that are fix in time to those that start only when a specific event or action occurs in the system:
- Functions
- There are a plethora of built-in features. We may use these functions to extract different parts of a date-time column, obtain substrings, and cast to different types. Remember that the current version of the service will not throw an expectation if the casting is not possible. It will only return a value of NULL.
- Low Latency
- The time between when data arrives at the service and when it is process is exceedingly brief.
- REST API
- All service management is done via a simple REST API, just like the rest of Microsoft Azure’s services. We can now construct our own management application or portal as a result of this.
How to create a Stream Analytics job by using the Azure portal?
Since we are now aware of the basic details and information of stream analytics, let’s learn how to create or use this azure product. This guide will walk you through the process of building a Stream Analytics task. You create a Stream Analytics task that analyses real-time streaming data and filters messages with a temperature greater than 27 in this quickstart. Your Stream Analytics job will read data from IoT Hub, transform it, and then write it to a blob storage container. This guide input data is generated via a Raspberry Pi online simulator. Let’s get started:
Before you start, make sure you have the following thing:
- Create a free account for an Azure subscription
- Next, sign in to the Azure portal.
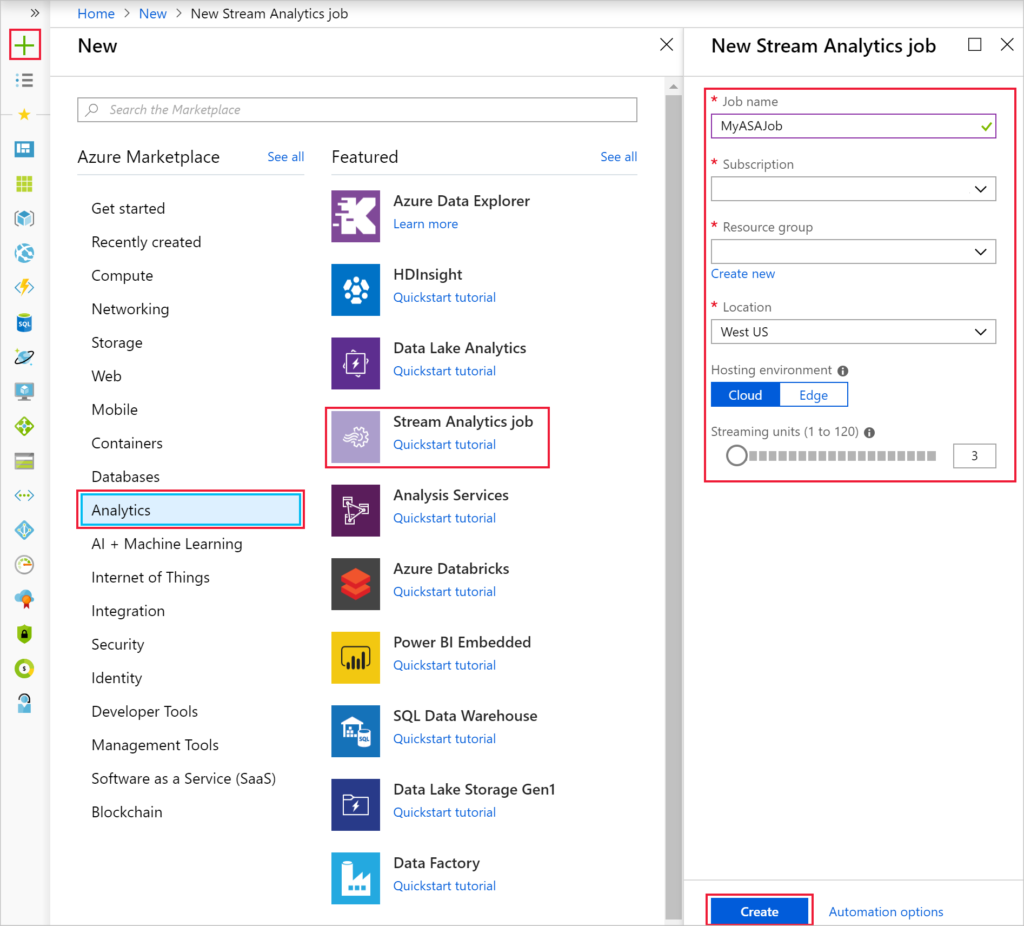
The next step is that you need to select Create a resource in the upper left-hand corner of the Azure portal. Then, select Analytics > Stream Analytics job from the results list. You need to fill out the Stream Analytics job page with the following information:
| Setting | Suggested value | Description |
|---|---|---|
| Job name | MyASAJob | Enter a name to identify your Stream Analytics job. Stream Analytics job name can contain alphanumeric characters, hyphens, and underscores only and it must be between 3 and 63 characters long. |
| Subscription | <Your subscription> | Select the Azure subscription that you want to use for this job. |
| Resource group | asaquickstart-resource group | Select the same resource group as your IoT Hub. |
| Location | <Select the region that is closest to your users> | Select a geographic location where you can host your Stream Analytics job. Use the location that’s closest to your users for better performance and to reduce the data transfer cost. |
| Streaming units | 1 | Streaming units represent the computing resources that are required to execute a job. By default, this value is set to 1. To learn about scaling streaming units, refer to the understanding and adjusting streaming units article. |
| Hosting environment | Cloud | Stream Analytics jobs can be deployed to the cloud or edge. Cloud allows you to deploy to Azure Cloud, and Edge allows you to deploy to an IoT Edge device. |

Source: Microsoft
The next thing you need to do is to check the Pin to dashboard box to place your job on your dashboard and then select Create.
You will be able to see a Deployment in progress… notification displayed in the top right of your browser window. Next, you need to learn how to configure the job output.
How to Configure job input?
You’ll configure an IoT Hub device input to the Stream Analytics job in this step. In the last portion of the quickstart, you constructed an IoT Hub. Follow the below mention steps:
- Navigate to your Stream Analytics job.
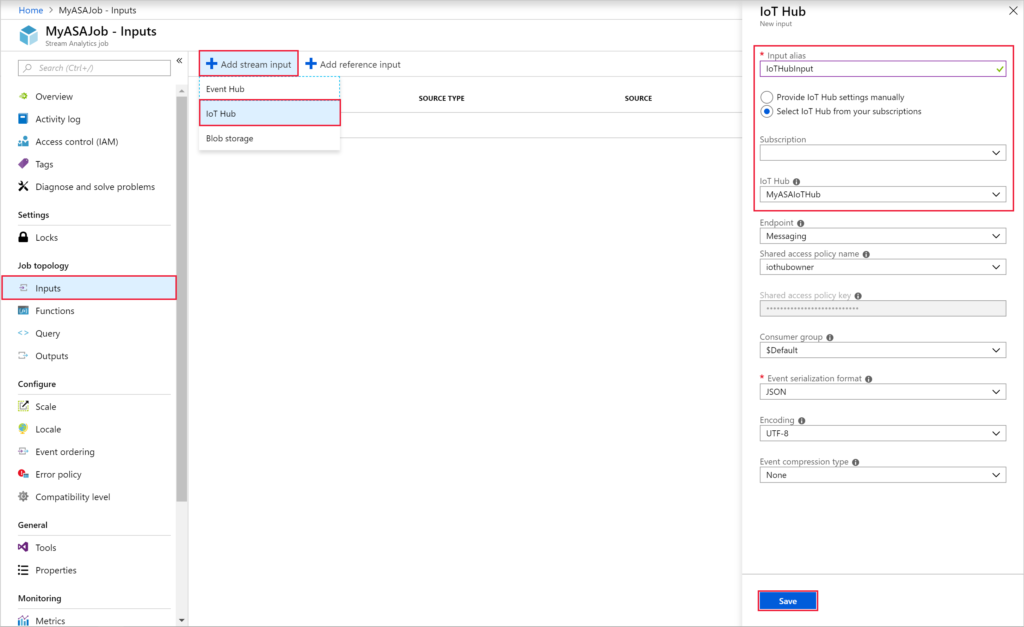
- Select Inputs > Add Stream input > IoT Hub.
- Fill out the IoT Hub page with the following values:
| setting | Suggested value | Description |
|---|---|---|
| Input alias | IoTHubInput | Enter a name to identify the job’s input. |
| Subscription | <Your subscription> | Select the Azure subscription that has the storage account you created. The storage account can be in the same or in a different subscription. This example assumes that you have created a storage account in the same subscription. |
| IoT Hub | MyASAIoTHub | Enter the name of the IoT Hub you created in the previous section. |

Source: Microsoft
It is also important to configure the job output. Let’s learn how to do this process.
- Navigate to the Stream Analytics job that you created earlier.
- Select Outputs > Add > Blob storage.
- Fill out the Blob storage page with the following values:
| Setting | Suggested value | Description |
|---|---|---|
| Output alias | BlobOutput | Enter a name to identify the job’s output. |
| Subscription | <Your subscription> | Select the Azure subscription that has the storage account you created. The storage account can be in the same or in a different subscription. This example assumes that you have created a storage account in the same subscription. |
| Storage account | asaquickstartstorage | Choose or enter the name of the storage account. Storage account names are automatically detected if they are created in the same subscription. |
| Container | container1 | Select the existing content that you created in your storage account. |
The next step is that you need to define the query. Follow the below mention steps for the same.
- Navigate to the Stream Analytics job that you created earlier.
- Select Query and update the query
Run the IoT simulator
Since now you have completed the query, you need to test and run the Iot simulator. Follow the following steps for the same:
- Open the Raspberry Pi Azure IoT Online Simulator.
- Replace the placeholder in Line 15 with the Azure IoT Hub device connection string you saved in a previous section.
- Click Run. The output should show the sensor data and messages that are being sent to your IoT Hub.
Start the Stream Analytics job and check the output
Now it’s time to check and run your output. For that follow the below-mentioned steps:
- Select Start when you return to the task overview page.
- For the Job output start time field, select Now under Start job. Then, to begin your job, select Start.
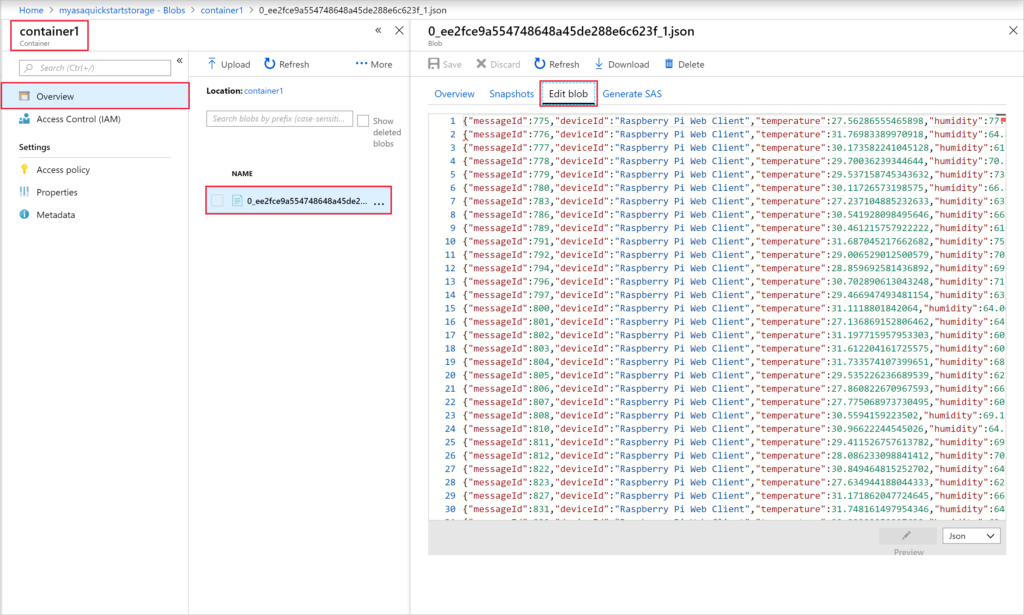
- After a few minutes, go to the site and look for the storage account and container you set up as the job’s output. The output file is now visible in the container. The job takes a few minutes to start the first time, but once it’s up and running, it’ll keep running as data comes in.

We should keep an eye on this service and be prepared to use it if we ever require real-time stream analytics. If you need SLAs, analyzing a stream in real-time is difficult. It’s not just about processing power. This is all the information about Azure Stream Analytics.


