Identify performance issues using DMVs
In this we will learn to identify performance issues using DMVs.
However, Microsoft Azure SQL Database and Azure SQL Managed Instance enable a subset of dynamic management views to diagnose performance problems, which might be caused by blocked or long-running queries, resource bottlenecks, poor query plans, and so on.
Microsoft Azure SQL Database and Azure SQL Managed Instance partially support three categories of dynamic management views:
- Firstly, Database-related dynamic management views.
- Secondly, Execution-related dynamic management views.
- Lastly, Transaction-related dynamic management views.
Permissions
In Azure SQL Database, querying a dynamic management view requires VIEW DATABASE STATE permissions. The VIEW DATABASE STATE permission returns information about all objects within the current database. Further, to grant the VIEW DATABASE STATE permission to a specific database user, run the following query:
SQL
GRANT VIEW DATABASE STATE TO database_user;
However, in Azure SQL Managed Instance, querying a dynamic management view requires VIEW SERVER STATE permissions. In an instance of SQL Server and in Azure SQL Managed Instance, dynamic management views return server state information. And, in Azure SQL Database, they return information regarding your current logical database only.
Identify CPU performance issues
If CPU consumption is above 80% for extended periods of time, consider the following troubleshooting steps:
The CPU issue is occurring now
If the issue is occurring right now, there are two possible scenarios:
However, Many individual queries that cumulatively consume high CPU
Use the following query to identify top query hashes:
SQL
PRINT ‘– top 10 Active CPU Consuming Queries (aggregated)–‘;
SELECT TOP 10 GETDATE() runtime, *
FROM (SELECT query_stats.query_hash, SUM(query_stats.cpu_time) ‘Total_Request_Cpu_Time_Ms’, SUM(logical_reads) ‘Total_Request_Logical_Reads’, MIN(start_time) ‘Earliest_Request_start_Time’, COUNT() ‘Number_Of_Requests’, SUBSTRING(REPLACE(REPLACE(MIN(query_stats.statement_text), CHAR(10), ‘ ‘), CHAR(13), ‘ ‘), 1, 256) AS “Statement_Text” FROM (SELECT req., SUBSTRING(ST.text, (req.statement_start_offset / 2)+1, ((CASE statement_end_offset WHEN -1 THEN DATALENGTH(ST.text)ELSE req.statement_end_offset END-req.statement_start_offset)/ 2)+1) AS statement_text
FROM sys.dm_exec_requests AS req
CROSS APPLY sys.dm_exec_sql_text(req.sql_handle) AS ST ) AS query_stats
GROUP BY query_hash) AS t
ORDER BY Total_Request_Cpu_Time_Ms DESC;
Next, Long running queries that consume CPU are still running
Use the following query to identify these queries:
SQL
PRINT ‘–top 10 Active CPU Consuming Queries by sessions–‘;
SELECT TOP 10 req.session_id, req.start_time, cpu_time ‘cpu_time_ms’, OBJECT_NAME(ST.objectid, ST.dbid) ‘ObjectName’, SUBSTRING(REPLACE(REPLACE(SUBSTRING(ST.text, (req.statement_start_offset / 2)+1, ((CASE statement_end_offset WHEN -1 THEN DATALENGTH(ST.text)ELSE req.statement_end_offset END-req.statement_start_offset)/ 2)+1), CHAR(10), ‘ ‘), CHAR(13), ‘ ‘), 1, 512) AS statement_text
FROM sys.dm_exec_requests AS req
CROSS APPLY sys.dm_exec_sql_text(req.sql_handle) AS ST
ORDER BY cpu_time DESC;
GO
Identify IO performance issues
When identifying IO performance issues, the top wait types associated with IO issues are:
- Firstly, PAGEIOLATCH_*
- This is for data file IO issues (including PAGEIOLATCH_SH, PAGEIOLATCH_EX, PAGEIOLATCH_UP). However, if the wait type name has IO in it, it points to an IO issue. And, if there is no IO in the page latch wait name, it points to a different type of problem (for example, tempdb contention).
- Secondly, WRITE_LOG
- For transaction log IO issues.
If the IO issue is occurring right now
Use the sys.dm_exec_requests or sys.dm_os_waiting_tasks to see the wait_type and wait_time.
Identify data and log IO usage
Use the following query to identify data and log IO usage. However, if the data or log IO is above 80%, it means users have used the available IO for the SQL Database service tier.
SQL
SELECT end_time, avg_data_io_percent, avg_log_write_percent
FROM sys.dm_db_resource_stats
ORDER BY end_time DESC;
Further, if the IO limit has been reached, you have two options:
- Option 1: Firstly, upgrade the compute size or service tier
- Option 2: Or, identify and tune the queries consuming the most IO.
Identify tempdb performance issues
When identifying IO performance issues, the top wait types associated with tempdb issues is PAGELATCH_* (not PAGEIOLATCH_). However, PAGELATCH_ waits do not always mean you have tempdb contention. This wait may also mean that you have user-object data page contention due to concurrent requests targeting the same data page. Further, to confirm tempdb contention, use sys.dm_exec_requests to confirm that the wait_resource value begins with 2:x:y where 2 is tempdb is the database ID, x is the file ID, and y is the page ID.
For tempdb contention, a common method is to reduce or re-write application code that relies on tempdb. Common tempdb usage areas include:
- Firstly, temp tables
- Secondly, table variables
- Thirdly, table-valued parameters
- Then, version store usage (specifically associated with long running transactions)
- Lastly, queries that have query plans that use sorts, hash joins, and spools

Identify memory grant wait performance issues
If your top wait type is RESOURCE_SEMAHPORE and you don’t have a high CPU usage issue, you may have a memory grant waiting issue.
Determine if a RESOURCE_SEMAHPORE wait is a top wait
Use the following query to determine if a RESOURCE_SEMAHPORE wait is a top wait
SQL
SELECT wait_type,
SUM(wait_time) AS total_wait_time_ms
FROM sys.dm_exec_requests AS req
JOIN sys.dm_exec_sessions AS sess
ON req.session_id = sess.session_id
WHERE is_user_process = 1
GROUP BY wait_type
ORDER BY SUM(wait_time) DESC;
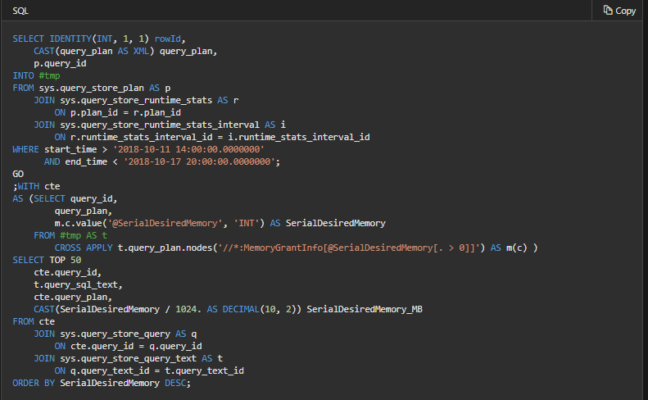
Identify high memory-consuming statements
Use the following query to identify high memory-consuming statements:
Calculating database and objects sizes
The following query returns the size of your database (in megabytes):
SQL
— Calculates the size of the database.
SELECT SUM(CAST(FILEPROPERTY(name, ‘SpaceUsed’) AS bigint) * 8192.) / 1024 / 1024 AS DatabaseSizeInMB
FROM sys.database_files
WHERE type_desc = ‘ROWS’;
GO
The following query returns the size of individual objects (in megabytes) in your database:
SQL
— Calculates the size of individual database objects.
SELECT sys.objects.name, SUM(reserved_page_count) * 8.0 / 1024
FROM sys.dm_db_partition_stats, sys.objects
WHERE sys.dm_db_partition_stats.object_id = sys.objects.object_id
GROUP BY sys.objects.name;
GO
Monitoring connections
You can use the sys.dm_exec_connections view to retrieve information about the connections established to a specific server and managed instance and the details of each connection. In addition, the sys.dm_exec_sessions view is helpful when retrieving information about all active user connections and internal tasks.
The following query retrieves information on the current connection:
SQL
SELECT
c.session_id, c.net_transport, c.encrypt_option,
c.auth_scheme, s.host_name, s.program_name,
s.client_interface_name, s.login_name, s.nt_domain,
s.nt_user_name, s.original_login_name, c.connect_time,
s.login_time
FROM sys.dm_exec_connections AS c
JOIN sys.dm_exec_sessions AS s
ON c.session_id = s.session_id
WHERE c.session_id = @@SPID;
Monitor resource use
You can monitor Azure SQL Database resource usage using SQL Database Query Performance Insight. For Azure SQL Database and Azure SQL Managed Instance, you can monitor using Query Store.
You can also monitor usage using these views:
- Firstly, Azure SQL Database: sys.dm_db_resource_stats
- Secondly, Azure SQL Managed Instance: sys.server_resource_stats
- Lastly, both Azure SQL Database and Azure SQL Managed Instance: sys.resource_stats
sys.dm_db_resource_stats
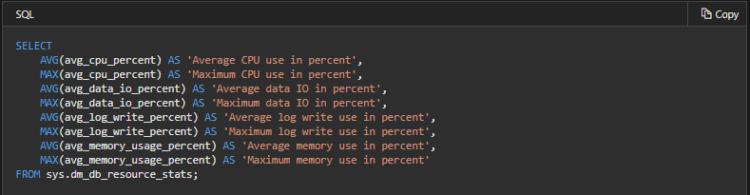
You can use the sys.dm_db_resource_stats view in every database. The sys.dm_db_resource_stats view shows recent resource use data relative to the service tier. However, average percentages for CPU, data IO, log writes, and memory are recorded every 15 seconds and are maintained for 1 hour.
For example, this query shows the average and maximum resource use for the current database over the past hour:
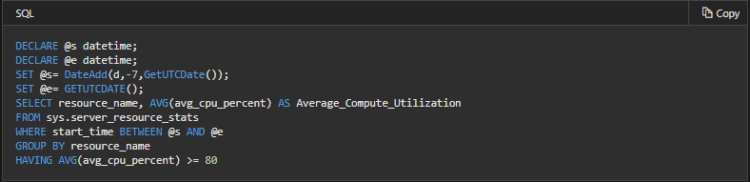
sys.server_resource_stats
You can use sys.server_resource_stats to return CPU usage, IO, and storage data for an Azure SQL Managed Instance. The data is collected and aggregated within five-minute intervals. There is one row for every 15 seconds of reporting. However, the data returned includes CPU usage, storage size, IO utilization, and managed instance SKU. Historical data is retained for approximately 14 days.
sys.resource_stats
The sys.resource_stats view in the master database has additional information that can help you monitor the performance of your database at its specific service tier and compute size. The data is collected every 5 minutes and is maintained for approximately 14 days. Further, from the data, this database currently has a peak CPU load of just over 50 percent CPU use relative to the P2 compute size (midday on Tuesday). If CPU is the dominant factor in the application’s resource profile, then you might decide that P2 is the right compute size to guarantee that the workload always fits.
However, if you expect an application to grow over time, it’s a good idea to have an extra resource buffer so that the application doesn’t ever reach the performance-level limit. And, if you increase the compute size, you can help avoid customer-visible errors that might occur when a database doesn’t have enough power to process requests effectively, especially in latency-sensitive environments.
However, the database engine exposes consumed resource information for each active database in the sys.resource_stats view of the master database in each server. The data in the table is aggregated for 5-minute intervals. With the Basic, Standard, and Premium service tiers, the data can take more than 5 minutes to appear in the table, so this data is more useful for historical analysis rather than near-real-time analysis
This example shows you how the data in this view is exposed:
SQL
SELECT TOP 10 *
FROM sys.resource_stats
WHERE database_name = ‘resource1’
ORDER BY start_time DESC

Reference: Microsoft Documentation