Database performance using Azure SQL Database Intelligent Performance
We’ll learn how to use Azure SQL Database Intelligent Performance to analyse database performance. Intelligent Insights in Azure SQL Database and Azure SQL Managed Instance, on the other hand, informs you about the performance of your database. Because they utilise artificial intelligence to continually monitor database usage and detect disruptive events that cause poor performance, they have built-in intelligence. When a problem is discovered, a full investigation is carried out, which results in the creation of an Intelligent Insights resource log (called SQLInsights) with an intelligent evaluation of the problem.
Intel7ligent Insights is a unique capability of Azure built-in intelligence that provides the following value:
- Firstly, proactive monitoring
- Secondly, tailored performance insights
- Thirdly, early detection of database performance degradation
- Then, root cause analysis of issues detected
- After that, performance improvement recommendations
- Scale out capability on hundreds of thousands of databases
- Lastly, positive impact to DevOps resources and the total cost of ownership
Intelligent Insights working
Intelligent Insights evaluates database performance by comparing the database workload from the previous hour to the baseline workload from the previous seven days. The most important queries to the database performance, such as the most repeated and biggest queries, make up the database workload. Each workload baseline is particular and unique to that workload since each database is unique in terms of structure, data, use, and application.
Artificial intelligence is used to discover a performance deterioration issue from various observable metrics, and then the analysis is carried out. A diagnostics log is created here, providing intelligent insight into what is going on with your database. From the moment an issue with database performance arises until it is resolved, Intelligent Insights makes it simple to keep track of it.
Furthermore, query duration, timeout requests, excessive wait times, and errored requests are utilized to measure and discover database performance concerns.
Intelligent Insights options
Intelligent Insights options available are:
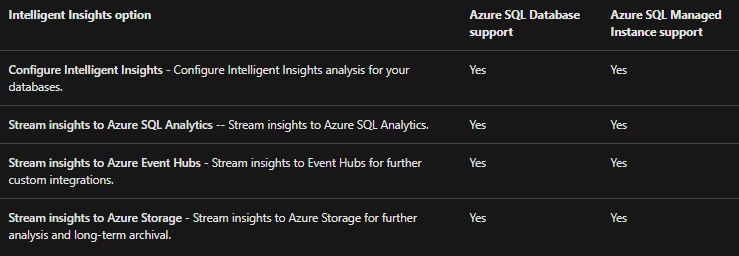
Configure the export of the Intelligent Insights log
The output of the Intelligent Insights can be streamed to one of several destinations for analysis:
- Firstly, output streamed to a Log Analytics workspace can be used with Azure SQL Analytics to view insights through the user interface of the Azure portal. This is the integrated Azure solution, and the most typical way to view insights.
- Secondly, output streamed to Azure Event Hubs can be used for development of custom monitoring and alerting scenarios
- Lastly, output streamed to Azure Storage can be used for custom application development. For example, custom reporting, long-term data archival and so forth.
The first step in integrating Azure SQL Analytics, Azure Event Hubs, Azure Storage, or third-party products for consumption is to enable Intelligent Insights logging (the “SQLInsights” log) in a database’s Diagnostic settings blade. Then setting the log data from Intelligent Insights to be delivered to one of these locations.
Set up with Azure SQL Analytics
- Firstly, Azure SQL Analytics solution provides graphical user interface, reporting and alerting capabilities on database performance, using the Intelligent Insights resource log data.
- Secondly, Add Azure SQL Analytics to your Azure portal dashboard from the marketplace and to create a workspace.
- Lastly, to use Intelligent Insights with Azure SQL Analytics, configure Intelligent Insights log data to be streamed to Azure SQL Analytics workspace.
Detection metrics
Metrics used for detection models that generate Intelligent Insights are based on monitoring:
- Firstly, query duration
- Secondly, timeout requests
- Thirdly, excessive wait time
- Lastly, errored out requests

The major models for detecting difficulties with database workload performance are query duration and timeout requests. They’re utilized because they provide a clear picture of what’s going on with the task. Excessive wait time and errored-out requests, on the other hand, are utilized as supplementary models to highlight issues that influence workload performance in order to discover all possible occurrences of workload performance deterioration.
Query duration
When compared to the performance baseline, the query duration degradation model examines individual queries and finds an increase in the time it takes to compile and execute a query. Built-in intelligence, on the other hand, recognizes a large rise in query compilation or query execution time, which has an impact on workload performance. Query duration performance degradation concerns are then identified for these queries.
Timeout requests
The timeout requests degradation model examines individual queries and finds any increases in query execution timeouts. Also compared to the performance baseline period are total request timeouts at the database level.
Some queries, however, may time out before they reach the execution step. Built-in intelligence measures and analyses all queries that reach the database, whether they get to the execution step or not, using aborted workers vs. requests made. A diagnostics log is supplied with intelligent insights when the number of timeouts for processed queries or the number of aborted request workers exceeds the system-managed threshold.
Excessive wait times
Individual database requests are monitored by the excessive wait time model. It identifies exceptionally high query delay stats that have exceeded the system’s absolute thresholds. However, utilizing Query Store Wait Stats (sys.query_store_wait_stats), the following query excessive wait-time metrics may be observed:
- Firstly, reaching resource limits
- Secondly, reaching elastic pool resource limits
- Then, excessive number of worker or session threads
- After that, excessive database locking
- Next, memory pressure
- Lastly, other wait stats
Errored requests
When compared to the baseline period, the errored requests degradation model watches individual queries and finds an increase in the number of queries that failed. Furthermore, this model keeps track of important exceptions that exceed the built-in intelligence’s absolute criteria. The system automatically adjusts for any workload changes throughout the monitoring time. This is done by taking into account the number of query queries made to the database.

Reference: Microsoft Documentation