Exam DA-100: Analyzing Data with Microsoft Power BI

Given the increasing demand of data analyst, certifications like Exam DA-100: Analyzing Data with Microsoft Power BI is really beneficial. They validate your expertise and equip you with the industry-relevant skills for using Power BI.
Exam DA-100: Analyzing Data with Microsoft Power BI will retire on March 31, 2022. A replacement exam, Exam PL-300: Microsoft Power BI Data Analyst, is available.
Preparation for this exam demands huge investment in time and efforts. You need to be consistent and determined so as to crack the exam. Also, you need to refer genuine and authentic sources while learning. Here we present you our tutorials and preparatory guide to help you pass the exam with flying colours.
What is DA-100: Analyzing Data with Microsoft Power BI ?
As a Data Analyst, your role will be to enable businesses to maximize the value of their data assets using Microsoft Power BI. This exam quips you with the understanding to become a subject matter expert who is responsible to perform the following tasks

- Firstly, Designing and building scalable data models
- Secondly, Cleaning and transforming data
- Lastly, Enabling advanced analytic capabilities to provide meaningful business value using easy-to-comprehend data visualizations.
Further, Data Analysts also collaborate with key stakeholders across verticals to deliver relevant insights based on identified business requirements.
Why choose Microsoft DA-100 Exam?
The highly acclaimed Microsoft DA-100 exam accelerates your career growth and definitely helps you climb up your professional ladder. This certification exam also guarantees the following benefits.

- Validates your skills
- This certification validates your mastery in managing and deploying devices and client applications in an enterprise environment. It also demonstrates your expertise and knowledge.
- Enhances Employability
- This certification proves your skills and therefore enhances your employability by making you job ready.
- Higher growth opportunities
- This certification guarantees high growth opportunities. About 23% of Microsoft certified professionals reported receiving up to a 20% salary increase. It also helps you chase further advanced goals in the field of IT.
- Provides competitive edge
- Microsoft Certifications provide you with a competitive edge over non certified candidates. It is estimated that certified employees earn 15% more than those without certification and are nearly 20% more productive.
- Brings recognition
- You’ll make immediate impact as a Microsoft Certified Professional. This credential will help you in getting noticed and bring recognition.
Certification Details
If you successfully passed the exam you get your MCSA certification -Microsoft Certified: Data Analyst Associate, which is valid for 2 years from the date you took the exam.

Exam Details: DA-100
Here are some basic details about the DA-100 exam:

- The Microsoft Analyzing Data with Power BI exam covers 40 to 60 questions. However, the Microsoft DA-100 exam questions can be of type multiple choice that is to be attempted in a time limit of 180 minutes.
- The DA-100 exam is available in English, Japanese, Chinese and Korean language.
- Further to pass this cloud computing type exam you need a score of 70%.

Prerequisites : DA-100
As a Data Analyst, it is suggested to have a fundamental understanding of data repositories and data processing both on-premises and in the cloud.
Before venturing in your preparation journey it is essential to have an understanding of the exam policies.
DA-100 Exam Retake Policy
If you were not able to clear the exam in the very first attempt, then remember it’s not the end of the road but just a small bump. Microsoft allows you 5 attempts per year for a specific exam. The exam retake policy is as follows-
- If a candidate is not able to clear the exam in the first attempt, the candidate must wait at least 24 hours before retaking the exam.
- If a candidate does not clear the exam the second time, candidate must wait at least 14 days before retaking the exam a third time.
- A 14-day waiting period is also there for the fourth and fifth subsequent exam retakes.
Cancellation and Reschedule Policy: Exam DA-100
Microsoft allows free cancelling of the Exam within 24 hours prior to your scheduled appointment.
But, if you fail to show up on your exam day without rescheduling or cancelling your exam, Microsoft reserves all rights to forfeit your entire exam fee.
Rescheduling and Cancellation of your scheduled exams can be done through the Certification Dashboard.
Exam FAQ: Microsoft DA-100
In order to qualify the DA-100 examination, you must have clarity about all the exam policies. For further queries visit Microsoft DA-100 exam FAQs
Exam Course: DA-100
The DA-100: Analyzing Data with Microsoft Power BI exam covers 5 domains. Further, each domain is divided into subtopics to provide complete clarity about the exam. Also, the percentage against each domain represents its weightage in the exam. Therefore, remember to devote enough time to domains with a higher percentage. The Microsoft DA-100 study guide covers the following topics:

Microsoft DA-100 Exam Course Outline was updated on March 23, 2021.
1. Prepare the data (20-25%)
Microsoft Learning Path- Prepare data for analysis
Get data from different data sources
- Identify and connect to a data source (Microsoft Documentation: Data sources in Power BI Desktop)
- Change data source settings (Microsoft Documentation: Manage data sources)
- Select a shared dataset or create a local dataset (Microsoft Documentation: Where your workbook file is saved makes a difference)
- Select a storage mode (Microsoft Documentation: Select a storage mode)
- Choose an appropriate query type (Microsoft Documentation: Query overview in Power BI Desktop)
- Identify query performance issues (Microsoft Documentation: Fix performance issues)
- Use Microsoft Dataverse (Microsoft Documentation: What is Common Data Service?)
- Using parameters
- Use or create a PBIDS file
- Use or create a data flow
- Connect to a dataset using the XMLA endpoint
Profile the data
- identify data anomalies (Microsoft Documentation: Visualize anomalies using batch detection and Power BI)
- examine data structures (Microsoft Documentation: Simplify the data structure)
- interrogate column properties
- interrogate data statistics (Microsoft Documentation: Worldwide Demographics & Statistics using Power Query and Power View)
Clean, transform, and load the data
- Resolve inconsistencies, unexpected or null values, and data quality issues (Microsoft Documentation: Tips and tricks for creating relationships in Power BI Desktop)
- Apply user-friendly value replacements (Microsoft Documentation: Replace values)
- Identify and create appropriate keys for joins (Microsoft Documentation: Model relationships in Power BI Desktop)
- Evaluate and transform column data types (Microsoft Documentation: Evaluate and change column data types)
- Apply data shape transformations to table structures (Microsoft Documentation: Shape and combine data in Power BI Desktop)
- Combine queries (Microsoft Documentation: merge queries)
- Apply user-friendly naming conventions to columns and queries
- Leverage advanced editor to modify power query m code (Microsoft Documentation: The Advanced Editor)
- Configure data loading
- Resolve data import errors (Microsoft Documentation: Resolve data import errors)
2. Model the data (25-30%)
Microsoft Learning Path- Model data in Power BI
Design a data model
- Define the tables (Microsoft Documentation: Tables in Power BI reports and dashboards)
- Configure table and column properties
- Define quick measures (Microsoft Documentation: Use quick measures for common calculations)
- Flatten out a parent-child hierarchy
- Define role-playing dimensions (Microsoft Documentation: Role-playing dimensions)
- Define a relationship’s cardinality and cross-filter direction (Microsoft Documentation: Cardinality)
- Design the data model to meet performance requirements (Microsoft Documentation: Optimization guide for Power BI)
- Resolve many-to-many relationships (Microsoft Documentation: Many-to-many relationship guidance)
- Create a common date table
- Define the appropriate level of data granularity
Develop a data model
- Apply cross-filter direction and security filtering (Microsoft Documentation: Enable bidirectional cross-filtering for DirectQuery in Power BI Desktop)
- Create calculated tables (Microsoft Documentation: Creating calculated tables in Power BI Desktop)
- Creating hierarchies
- Creating calculated columns (Microsoft Documentation: Create calculated columns in Power BI Desktop)
- Implement row-level security roles (Microsoft Documentation: Restrict data access with row-level security (RLS) for Power BI Desktop)
- Set up the q&a feature (Microsoft Documentation: Use Power BI Q&A to explore your data and create visuals)
Create measures by using DAX
- Use DAX to build complex measures (Microsoft Documentation: Create and use your own measures)
- Use CALCULATE to manipulate filters (Microsoft Documentation: DAX: Avoid using FILTER as a filter argument)
- Implement Time Intelligence using DAX (Microsoft Documentation: Time intelligence functions)
- Replace numeric columns with measures (Microsoft Documentation: REPLACE)
- Use basic statistical functions to enhance data (Microsoft Documentation: Statistical functions)
- Create semi-additive measures (Microsoft Documentation: Define Semiadditive Behavior)
Optimize model performance
- Remove unnecessary rows and columns
- Identify poorly performing measures, relationships, and visuals (Microsoft Documentation: Optimization guide for Power BI)
- Improve cardinality levels by changing data types (Microsoft Documentation: Data reduction techniques for Import modeling)
- Improve cardinality levels through summarization
- Create and manage aggregations (Microsoft Documentation: Create and manage aggregations)
3. Visualize the data (20-25%)
Microsoft Learning Path- Visualize data in Power BI
Create reports
- Add visualization items to reports (Microsoft Documentation: Add visuals to a Power BI report)
- Choose an appropriate visualization type (Microsoft Documentation: Visualization types in Power BI)
- Format and configure visualizations (Microsoft Documentation: Getting started with the formatting pane)
- Import a custom visual (Microsoft Documentation: Visual files)
- Configure conditional formatting (Microsoft Documentation: Use conditional formatting in tables)
- Apply slicing and filtering (Microsoft Documentation: Slicers in Power BI)
- Add an r or python visual (Microsoft Documentation: Create Power BI visuals by using Python)
- Configure the report page (Microsoft Documentation: Change the display of a report page)
- Design and configure for accessibility (Microsoft Documentation: Design Power BI reports for accessibility)
- Configure automatic page refresh
- Create a paginated report
Create dashboards
- Set mobile view (Microsoft Documentation: Optimize a dashboard for mobile phones – Power BI)
- Manage tiles on a dashboard (Microsoft Documentation: Edit or remove a dashboard tile)
- Configure data alerts (Microsoft Documentation: Tutorial: Set alerts on Power BI dashboards)
- Use the q&a feature (Microsoft Documentation: Q&A on dashboards)
- Add a dashboard theme (Microsoft Documentation: Use Dashboard Themes in Power BI service)
- Pin a live report page to a dashboard (Microsoft Documentation: Pin an entire report page, as a live tile, to a Power BI dashboard)
Enrich reports for usability
- Configure bookmarks (Microsoft Documentation: Create bookmarks in Power BI Desktop to share insights and build stories)
- Create custom tooltips (Microsoft Documentation: Customize tooltips in Power BI Desktop)
- Edit and configure interactions (Microsoft Documentation: Change how visuals interact in a Power BI report)
- Use the selection pane
- Use drill through and cross filter
- Drilldown into data using interactive visuals (Microsoft Documentation: Drill mode in a visual in Power BI)
- Export report data between visuals (Microsoft Documentation: Export the data that was used to create a visualization)
- Configure navigation for a report
- Apply sorting (Microsoft Documentation: Sort by column in Power BI Desktop)
- Configure sync slicers (Microsoft Documentation: Sync and use slicers on other pages)
4. Analyze the data (10-15%)
Microsoft Learning Path- Data analysis in Power BI
Enhance reports to expose insights
- Apply conditional formatting (Microsoft Documentation: Use conditional formatting in tables)
- Apply slicers and filters
- Perform top n analysis
- Explore statistical summary (Microsoft Documentation: Explore statistical summary)
- Use the q&a visual (Microsoft Documentation: Use the Q&A visual)
- Add a quick insights result to a report (Microsoft Documentation: Review Quick insights)
- Create reference lines by using analytics pane (Microsoft Documentation: Use the Analytics pane)
- Use the play axis feature of a visualization
- Personalize Visuals
Perform advanced analysis
- Identify outliers (Microsoft Documentation: Identify outliers with Power BI visuals)
- Conduct time series analysis (Microsoft Documentation: Conduct time series analysis)
- Use groupings and innings (Microsoft Documentation: Use grouping and binning in Power BI Desktop)
- Using the key influencers to explore dimensional variances (Microsoft Documentation: Find important factors with the Key influencers visual)
- Using the decomposition tree visual to break down a measure (Microsoft Documentation: Use the Decomposition Tree visual to break down a measure)
- Apply ai insights (Microsoft Documentation: Use AI Insights in Power BI Desktop)
5. Deploy and maintain deliverables (10-15%)
Microsoft Learning Path- Data analysis in Power BI
Manage datasets
- Configure a dataset scheduled refresh (Microsoft Documentation: Configure scheduled refresh)
- Configure row-level security group membership
- Providing access to datasets (Microsoft Documentation: Build permission for shared datasets)
- Configure incremental refresh settings (Microsoft Documentation: Incremental refresh in Power BI)
- Promote or Certify PowerBI datasets
- Identify downstream Dataset Dependencies
- Configure large dataset format
Create and manage workspaces
- Create and configure a workspace (Microsoft Documentation: Create the new workspaces in Power BI)
- Recommend a development lifecycle strategy
- Assign workspace roles (Microsoft Documentation: Roles in the new workspaces)
- Configure and update a workspace app (Microsoft Documentation: Change your published app)
- Publish, import, or update assets in a workspace (Microsoft Documentation: Publish an app in Power BI)
- Apply sensitivity labels to workspace content
- Use Deployment pipelines
- Configure subscriptions
- Promote or certify Power BI content
Preparatory Guide for Microsoft Exam DA-100
The key to successfully pass an exam is by preparing right. Preparations demand consistency and determination. There are plenty resources available, for your preparations. You must have the right information and tools to crack the exam. We present you our specially curated preparatory guide to help you pass the Microsoft DA-100 Power BI exam in the very first attempt. Let’s discuss step by step.

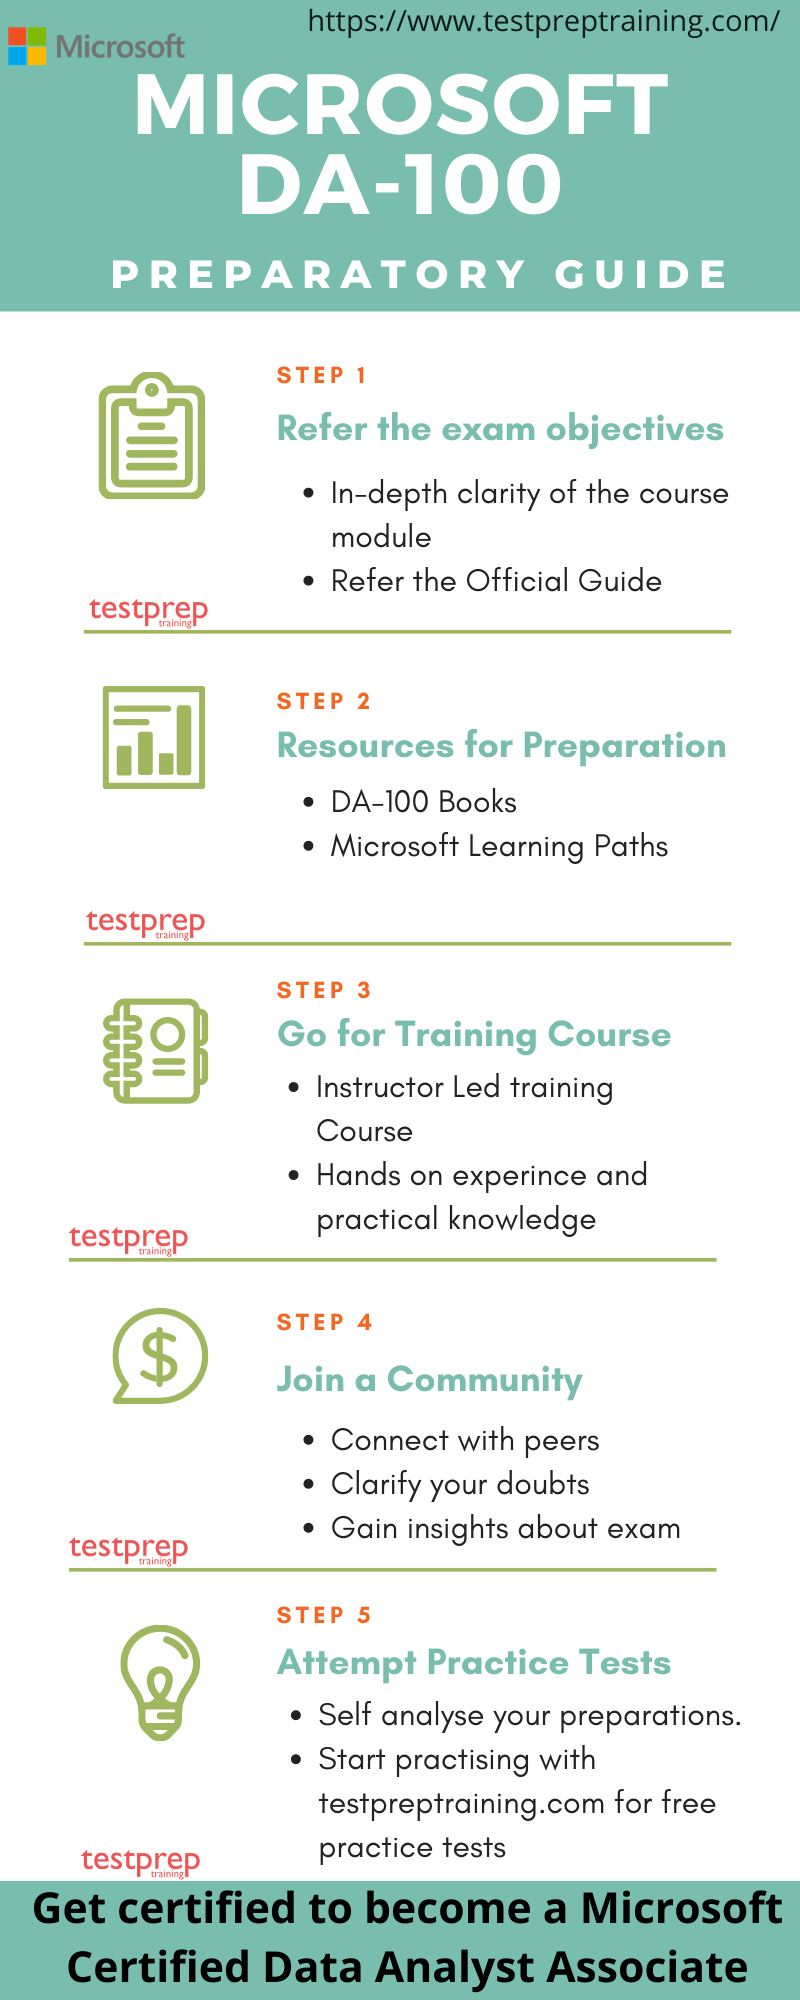
Step 1- Refer the Official Guide
Firstly, you need to go through the Official Microsoft DA-100 Study Guide. Familiarise yourself with all the objectives and course domains of the exam. Further, devote enough time to each topic and have in depth knowledge of the subject by tailoring your study focus around the course domains. Moreover, the official guide acts as a blueprint for the exam.
Step 2- Look out for resources
There are various learning resources available in the market place for your Microsoft DA-100 exam. Remember to refer the ones that best suit you and support your preparations.

Books your ultimate friends
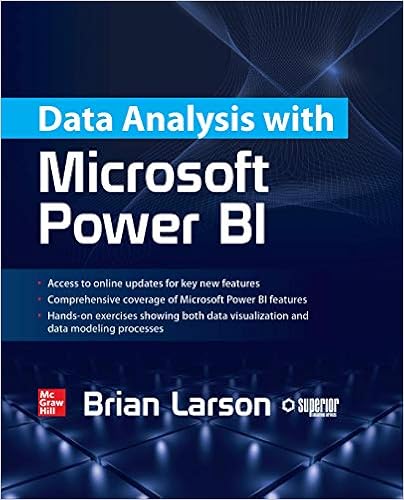
Books are the most important ingredient of the preparation. There are a vast variety of books available in the market which you can use to prepare for the Microsoft DA-100 Exam. Therefore, our suggestion to you would be to find the Microsoft DA-100 book from genuine sources. We recommend you to refer the Data Analysis with Microsoft Power BI Book by Brian Larson.
Microsoft Learning Paths
Microsoft provides you with their learning paths which are a great way to prepare for the exam. These modules help you learn through hands on experience and include technical workshops. Moreover, Microsoft Learn provides a new approach to learning by offering on-demand dynamic and interactive experience. Remember to refer them during your preparation journey.
Microsoft offers the Get started with Microsoft data analytics Learning Path for DA-100 exam
Step 3- Go for Training Course
Microsoft offers their training courses to provide you with the necessary tools and resources. These Microsoft DA-100 training courses aid your preparations by providing you the practical experience for the exam. Microsoft offers its instructor led training course-
Analyzing Data with Microsoft Power BI
This course will discuss the various methods and best practices that are in line with business and technical requirements for modeling, visualizing, and analyzing data with Power BI. The course will also show how to access and process data from a range of data sources including both relational and non-relational data.
Skills Acquired
- Ingest, clean, and transform data
- Model data for performance and scalability
- Design and create reports for data analysis
- Apply and perform advanced report analytics
- Manage and share report assets
- Create paginated reports in Power BI
Step 4 – Join a community
Online forums and study groups are indeed a great way to prepare for the DA-100 Exam. The best way to get in touch with other candidates is through study forums or online groups. Moreover, you can ask a question related to the topic you’re having difficulty with.
Also, such groups provide regular insights about the exams. The discussions are really beneficial for you to excel the exam.
Step 5 – Attempt Practice Tests
Finally, it is time to check your preparations. Self-Evaluation is the key and hence your next step is to go for practice tests. The more you’re going to practice, the better for you. Moreover, these practice tests provide you with the real exam environment and also help you analyze areas that need improvement. Strengthening your weaker domains will surely help you pass with flying colors. Therefore, attempt as many Microsoft DA-100 practice exam tests as you can. Start practising now.
Enhance your skills and upgrade your profile by qualifying the DA-100 Analyzing Data with Microsoft Power BI exam. Start your preparations Now!
Analyzing Data with Microsoft Power BI Exam (DA-100) Online Tutorial
While preparing for Microsoft Exam DA-100: Analyzing Data with Microsoft Power BI it is very important for you to have the right set of resources with the right preparation guide to sail through and qualify the exam. With enormous set of resources available to choose from, selecting the right fit is what makes the difference. We provide you with last-minute preparation guide to help you prepare better.

Prepare the data (20-25%)
Getting Data from different Data Sources
- Connect to a data source
- Managing data source
- Saving a Workbook File
- Selecting a storage mode
- Overview of Query in Power BI Desktop
- Identify query performance issues
- Using Microsoft Dataverse
- Use Parameters
- Using PBIDS file
- Using Data Flows
Profile the data
- Visualize data anomalies
- Analyze data structures
- Column properties
- Interrogate data statistics
Clean, transform, and load the data
- Handling inconsistencies, unexpected or null values, and data quality issues
- Apply user-friendly value replacements
- Overview of Model Relationships in Power BI Desktop
- Evaluating and Transforming Column Data Types
- Shape and Combine Data in Power BI Desktop
- Combine Data and Queries
- Apply user-friendly naming conventions to columns and queries
- Using the advanced editor to modify power query m code
- Configure data loading
- Resolve data import errors
Model the data (25-30%)
Microsoft Learning Path- Model data in Power BI
Design a data model
- Define the tables
- Configure table and column properties
- Using quick measures
- Flatten out a parent-child hierarchy
- Define role-playing dimensions
- Relationship’s cardinality and cross-filter direction
- Optimized Power BI Solution to meet performance requirements
- Resolve many-to-many relationships
- Create a common date table
- Define the appropriate level of data granularity
Develop a data model
- Cross-filter direction and security filtering
- Create calculated tables
- Creating hierarchies
- Create calculated columns
- Implement row-level security roles
- Using Power BI q&a feature
Create measures by using DAX
- Create Measures with DAX
- Using CALCULATE Function
- Time Intelligence Using DAX
- Replace Function with measures
- Using statistical functions with DAX
- Define semi-additive Behavior
Optimize model performance
- Remove unnecessary rows and columns
- Optimizing Guide for Power BI for measures, relationships, and visuals
- Improve cardinality levels by changing data types and through summarization
- Learn to Create and Manage Aggregations
Visualize the data (20-25%)
Microsoft Learning Path- Visualize data in Power BI
Create reports
- Add visualization items to reports
- Choose an appropriate visualization type
- Format and configure visualizations
- Import a custom visual
- Configure conditional formatting
- Apply slicing and filtering
- Create Power BI visuals using Python
- Configure the report page
- Design and configure for accessibility
Create dashboards
- Set mobile view
- Manage tiles on a dashboard
- Configure data alerts
- Use the q&a feature
- Add a dashboard theme
- Pin a live report page to a dashboard
- Configure data classification
Enrich reports for usability
- Configure bookmarks
- Create custom tooltips
- Edit and configure interactions
- Use the selection pane
- Use drill through and cross filter
- Drilldown into data using interactive visuals
- Export report data between visuals
- Configure navigation for a report
- Apply sorting
- Configure sync slicers
Analyze the data (10-15%)
Microsoft Learning Path- Data analysis in Power BI
Enhance reports to expose insights
- Apply conditional formatting
- Apply slicers and filters
- Perform top n analysis
- Explore statistical summary
- Use the q&a visual
- Add a quick insights result to a report
- Create reference lines by using analytics pane
- Use the play axis feature of a visualization
- Personalize Visuals
Perform advanced analysis
- Identify outliers
- Conduct time series analysis
- Use groupings and innings
- Using the key influencers to explore dimensional variances
- Use the decomposition tree visual to break down a measure
- Apply ai insights
Deploy and maintain deliverables (10-15%)
Microsoft Learning Path- Data analysis in Power BI
Manage datasets
- Configure a dataset scheduled refresh
- Configure row-level security group membership
- Providing access to datasets
- Configure incremental refresh settings
- Promote or Certify PowerBI Content
- Identify downstream Dataset Dependencies
- Endorse a dataset
Create and manage workspaces
- Create and configure a workspace
- Recommend a development lifecycle strategy
- Assign workspace roles
- Configure and update a workspace app
- Publish, import, or update assets in a workspace
- Apply sensitivity labels to workspace content
- Use Deployment pipelines


