Want to elevate your career with a professional certification? Are you confused about where to start you revisions from? Don’t worry as you have arrived at the right place. This Analyzing Data with Microsoft Power BI DA-100 Cheat Sheet is all you need to kick start your revisions. It will provide you with a quick summary of all the resources you need to pass the exam. Moreover, it will act as your golden ticket to achieve your credential.
This examination will authenticate your proficiency and furnish you with industry-relevant skills for utilizing Power BI. Consistency and determination are crucial for success in cracking this exam. This cheat sheet serves as your guide for thorough revisions. But first, let’s quickly review the exam details.
Microsoft DA-100: Exam Overview
In the role of a Data Analyst, your responsibility is to empower businesses in optimizing the value of their data assets through Microsoft Power BI. This exam equips you with the knowledge to evolve into a subject matter expert, tasked with executing the following responsibilities:
- Firstly, Designing and building scalable data models
- Secondly, Cleaning and transforming data
- Lastly, Enabling advanced analytic capabilities to provide meaningful business value using easy-to-comprehend data visualizations.
Moreover, Data Analysts collaborate with essential stakeholders across various sectors to provide pertinent insights in alignment with identified business requirements.
Certification Details: Microsoft DA-100
If you successfully passed the exam you get your MCSA certification -Microsoft Certified: Data Analyst Associate, which is valid for 2 years from the date you take the exam.

Exam Prerequisites
For a Data Analyst, it is recommended to have a foundational comprehension of data repositories and data processing, both in on-premises and cloud environments.
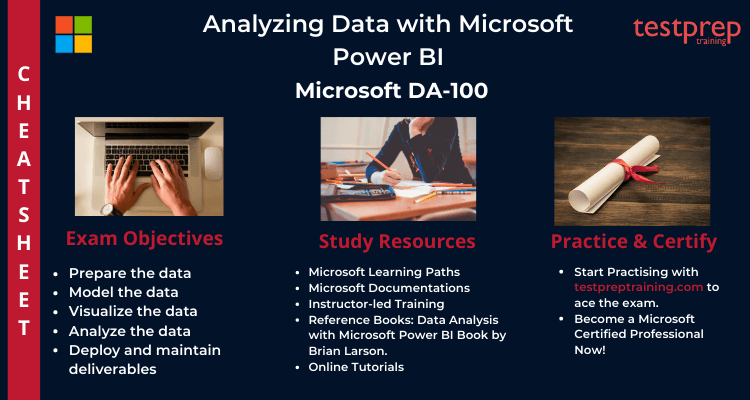
Cheat Sheet for Analyzing Data with Microsoft Power BI DA-100
This exam is a stepping stone to your dream career therefore, you should prepare with all your focus. Revising for the exam is a huge task. This Cheat Sheet details the steps that will ensure your success in the exam. Also, it highlights the resources that will define your journey to success.

Deeply Analyse the Exam Objectives
Firstly, you must have a clear understanding of the exam rules and policies. You should familiarise yourself with the exam course and concepts to excel in the exam. Moreover, tailoring your study plan around the exam objectives is important for your preparations. You must devote enough time to each of 5 domains that this exam covers. The Microsoft DA-100 study guide covers the following topics:
Microsoft DA-100 Exam Course Outline was updated on March 23, 2021.
Prepare the data (20-25%)
Microsoft Learning Path- Prepare data for analysis
Get data from different data sources
- Identify and connect to a data source (Microsoft Documentation: Data sources in Power BI Desktop)
- Change data source settings (Microsoft Documentation: Manage data sources)
- Select a shared dataset or create a local dataset (Microsoft Documentation: Where your workbook file is saved makes a difference)
- Select a storage mode (Microsoft Documentation: Select a storage mode)
- Choose an appropriate query type (Microsoft Documentation: Query overview in Power BI Desktop)
- Identify query performance issues (Microsoft Documentation: Fix performance issues)
- Use Microsoft Dataverse (Microsoft Documentation: What is Common Data Service?)
- Use parameters
- Use or create a PBIDS file
- Use or create a data flow
- Connect to a dataset using the XMLA endpoint
Profile the data
- identify data anomalies (Microsoft Documentation: Visualize anomalies using batch detection and Power BI)
- examine data structures (Microsoft Documentation: Simplify the data structure)
- interrogate column properties
- interrogate data statistics (Microsoft Documentation: Worldwide Demographics & Statistics using Power Query and Power View)
Clean, transform, and load the data
- Resolve inconsistencies, unexpected or null values, and data quality issues (Microsoft Documentation: Tips and tricks for creating relationships in Power BI Desktop)
- Apply user-friendly value replacements (Microsoft Documentation: Replace values)
- Identify and create appropriate keys for joins (Microsoft Documentation: Model relationships in Power BI Desktop)
- Evaluate and transform column data types (Microsoft Documentation: Evaluate and change column data types)
- Apply data shape transformations to table structures (Microsoft Documentation: Shape and combine data in Power BI Desktop)
- Combine queries (Microsoft Documentation: merge queries)
- Apply user-friendly naming conventions to columns and queries
- Leverage advanced editor to modify power query m code (Microsoft Documentation: The Advanced Editor)
- Configure data loading
- Resolve data import errors (Microsoft Documentation: Resolve data import errors)
Model the data (25-30%)
Microsoft Learning Path- Model data in Power BI
Design a data model
- Define the tables (Microsoft Documentation: Tables in Power BI reports and dashboards)
- Configure table and column properties
- Define quick measures (Microsoft Documentation: Use quick measures for common calculations)
- Flatten out a parent-child hierarchy
- Define role-playing dimensions (Microsoft Documentation: Role-playing dimensions)
- Define a relationship’s cardinality and cross-filter direction (Microsoft Documentation: Cardinality)
- Design the data model to meet performance requirements (Microsoft Documentation: Optimization guide for Power BI)
- Resolve many-to-many relationships (Microsoft Documentation: Many-to-many relationship guidance)
- Create a common date table
- Define the appropriate level of data granularity
Develop a data model
- Apply cross-filter direction and security filtering (Microsoft Documentation: Enable bidirectional cross-filtering for DirectQuery in Power BI Desktop)
- Create calculated tables (Microsoft Documentation: Create calculated tables in Power BI Desktop)
- Create hierarchies
- Create calculated columns (Microsoft Documentation: Create calculated columns in Power BI Desktop)
- Implement row-level security roles (Microsoft Documentation: Restrict data access with row-level security (RLS) for Power BI Desktop)
- Set up the q&a feature (Microsoft Documentation: Use Power BI Q&A to explore your data and create visuals)
Create measures by using DAX
- Use DAX to build complex measures (Microsoft Documentation: Create and use your own measures)
- Use CALCULATE to manipulate filters (Microsoft Documentation: DAX: Avoid using FILTER as a filter argument)
- Implement Time Intelligence using DAX (Microsoft Documentation: Time intelligence functions)
- Replace numeric columns with measures (Microsoft Documentation: REPLACE)
- Use basic statistical functions to enhance data (Microsoft Documentation: Statistical functions)
- Create semi-additive measures (Microsoft Documentation: Define Semiadditive Behavior)
Optimize model performance
- Remove unnecessary rows and columns
- Identify poorly performing measures, relationships, and visuals (Microsoft Documentation: Optimization guide for Power BI)
- Improve cardinality levels by changing data types (Microsoft Documentation: Data reduction techniques for Import modeling)
- Improve cardinality levels through summarization
- Create and manage aggregations (Microsoft Documentation: Create and manage aggregations)
Visualize the data (20-25%)
Microsoft Learning Path- Visualize data in Power BI
Create reports
- Add visualization items to reports (Microsoft Documentation: Add visuals to a Power BI report)
- Choose an appropriate visualization type (Microsoft Documentation: Visualization types in Power BI)
- Format and configure visualizations (Microsoft Documentation: Getting started with the formatting pane)
- Import a custom visual (Microsoft Documentation: Visual files)
- Configure conditional formatting (Microsoft Documentation: Use conditional formatting in tables)
- Apply slicing and filtering (Microsoft Documentation: Slicers in Power BI)
- Add an r or python visual (Microsoft Documentation: Create Power BI visuals by using Python)
- Configure the report page (Microsoft Documentation: Change the display of a report page)
- Design and configure for accessibility (Microsoft Documentation: Design Power BI reports for accessibility)
- Configure automatic page refresh
- Create a paginated report
Create dashboards
- Set mobile view (Microsoft Documentation: Optimize a dashboard for mobile phones – Power BI)
- Manage tiles on a dashboard (Microsoft Documentation: Edit or remove a dashboard tile)
- Configure data alerts (Microsoft Documentation: Tutorial: Set alerts on Power BI dashboards)
- Use the q&a feature (Microsoft Documentation: Q&A on dashboards)
- Add a dashboard theme (Microsoft Documentation: Use Dashboard Themes in Power BI service)
- Pin a live report page to a dashboard (Microsoft Documentation: Pin an entire report page, as a live tile, to a Power BI dashboard)
Enrich reports for usability
- Configure bookmarks (Microsoft Documentation: Create bookmarks in Power BI Desktop to share insights and build stories)
- Create custom tooltips (Microsoft Documentation: Customize tooltips in Power BI Desktop)
- Edit and configure interactions (Microsoft Documentation: Change how visuals interact in a Power BI report)
- Use the selection pane
- Use drill through and cross filter
- Drilldown into data using interactive visuals (Microsoft Documentation: Drill mode in a visual in Power BI)
- Export report data between visuals (Microsoft Documentation: Export the data that was used to create a visualization)
- Configure navigation for a report
- Apply sorting (Microsoft Documentation: Sort by column in Power BI Desktop)
- Configure sync slicers (Microsoft Documentation: Sync and use slicers on other pages)
Analyze the data (10-15%)
Microsoft Learning Path- Data analysis in Power BI
Enhance reports to expose insights
- Apply conditional formatting (Microsoft Documentation: Use conditional formatting in tables)
- Apply slicers and filters
- Perform top n analysis
- Explore statistical summary (Microsoft Documentation: Explore statistical summary)
- Use the q&a visual (Microsoft Documentation: Use the Q&A visual)
- Add a quick insights result to a report (Microsoft Documentation: Review Quick insights)
- Create reference lines by using analytics pane (Microsoft Documentation: Use the Analytics pane)
- Use the play axis feature of a visualization
- Personalize Visuals
Perform advanced analysis
- Identify outliers (Microsoft Documentation: Identify outliers with Power BI visuals)
- Conduct time series analysis (Microsoft Documentation: Conduct time series analysis)
- Use groupings and innings (Microsoft Documentation: Use grouping and binning in Power BI Desktop)
- Use the key influencers to explore dimensional variances (Microsoft Documentation: Find important factors with the Key influencers visual)
- Use the decomposition tree visual to break down a measure (Microsoft Documentation: Use the Decomposition Tree visual to break down a measure)
- Apply ai insights (Microsoft Documentation: Use AI Insights in Power BI Desktop)
Deploy and maintain deliverables (10-15%)
Microsoft Learning Path- Data analysis in Power BI
Manage datasets
- Configure a dataset scheduled refresh (Microsoft Documentation: Configure scheduled refresh)
- Configure row-level security group membership
- Providing access to datasets (Microsoft Documentation: Build permission for shared datasets)
- Configure incremental refresh settings (Microsoft Documentation: Incremental refresh in Power BI)
- Promote or Certify PowerBI datasets
- Identify downstream Dataset Dependencies
- Configure large dataset format
Create and manage workspaces
- Create and configure a workspace (Microsoft Documentation: Create the new workspaces in Power BI)
- Recommend a development lifecycle strategy
- Assign workspace roles (Microsoft Documentation: Roles in the new workspaces)
- Configure and update a workspace app (Microsoft Documentation: Change your published app)
- Publish, import, or update assets in a workspace (Microsoft Documentation: Publish an app in Power BI)
- Apply sensitivity labels to workspace content
- Use Deployment pipelines
- Configure subscriptions
- Promote or certify Power BI content
Start preparing for DA-100 exam using the Preparation Guide!
Resources to supplement your learning
Choosing the right resources with reliable content is very important. Make sure the content is precise and reliable enough. As you have probably been preparing for this exam we hope that you have made a wise choice in terms of your learning resources. However, here are a few quick links that will definitely benefit your preparations and help you ace the exam:

Books your ultimate friends
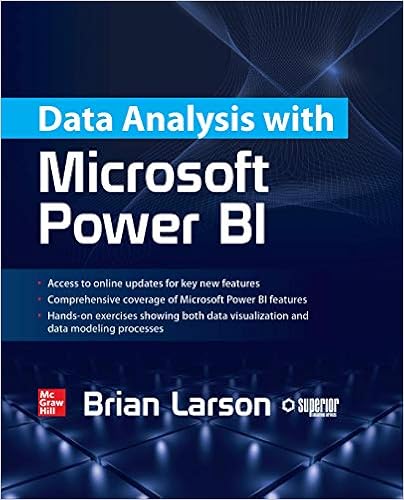
Books are the most important ingredient of the preparation. There are a vast variety of books available in the market which you can use to prepare for the Microsoft DA-100 certification Exam. Therefore, our suggestion to you would be to find the Microsoft DA-100 book from genuine sources. We recommend you refer to the Data Analysis with Microsoft Power BI Book by Brian Larson.
Microsoft Learning Paths
Microsoft provides you with their learning paths which are a great way to prepare for the exam. These modules help you learn through hands on experience and include technical workshops. Moreover, Microsoft Learn provides a new approach to learning by offering on-demand dynamic and interactive experience. Remember to refer them during your preparation journey.
Microsoft offers the Get started with Microsoft data analytics Learning Path for DA-100 exam
Training Course
Microsoft offers their training courses to provide you with the necessary tools and resources. These Microsoft DA-100 training courses aid your preparations by providing you the practical experience for the exam. Microsoft offers its instructor led training course-
Analyzing Data with Microsoft Power BI
In this course, you will explore different techniques and optimal approaches aligned with both business and technical needs for modeling, visualizing, and analyzing data using Power BI. Additionally, the course will demonstrate how to retrieve and process data from various sources, encompassing both relational and non-relational data.
Skills Acquired
- Firstly, Ingest, clean, and transform data
- Secondly, Model data for performance and scalability
- Thirdly, Design and create reports for data analysis
- Also, Apply and perform advanced report analytics
- Further, Manage and share report assets
- Finally, Create paginated reports in Power B
Online Tutorials
Online Tutorials provide you descriptive details about the exam and its policies. They help in mastering the exam concepts and ease your preparations. Remember that cheat sheet is not sufficient for qualifying the exam. You must begin your preparations with DA-100 Online Tutorials. .
Attempt Practice Tests
The final recommendation for your preparatory guide involves practice tests. Microsoft DA-100 Practice Exam tests provide assistance by offering the experience of a real examination. They provide quick results and detailed reports of the candidate’s performance, which eventually helps the candidate to find out the areas of strengths and weaknesses in different domains. Further attempt multiple practice tests to keep a check on your preparations. Also, aim at performing better in each subsequent test. This will in turn boost your confidence and make you exam ready. Start using DA-100 practice exam tests now.


